
用Excel绘制函数平面曲线的研究.docx

快乐****蜜蜂


1/2

2/2
在线预览结束,喜欢就下载吧,查找使用更方便
相关资料

用Excel绘制函数平面曲线的研究.docx
用Excel绘制函数平面曲线的研究Excelisaversatiletoolfordataanalysisandvisualization.Oneofitsapplicationsistodrawgraphsofmathematicalfunctions,whichisausefultoolinexploringandunderstandingthebehaviorofdifferentmathematicalmodelsindifferentdomains.Inthispaper,wewilldiscu

用excel绘制函数图像(学案).doc
高一年级信息技术学案时间3.27-4.1郭俊苗编用Excel2003制作函数图像【学习目标】加深对EXCEL中图表功能的理解;学会使用图表的功能来绘制三角函数的图像;学会用Excel制作函数图像【重点难点】制作函数图像【学习过程】操作任务:利用EXCEL中的图表功能绘制三角函数图像(绘制正弦函数在[0,2π]内的图像)。步骤:新建excel工作表,在sheet1表单中完成下列操作:1、取点——在EXCEL中输入数据;点的选取可多可少,但为了保证图像的精确性,我们可多取几个点(利用EXCEL的填充功能)。在
在EXCEL中绘制函数图.ppt
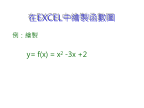
在EXCEL中繪製函數圖輸入X方向的起始值產生所需要的X值:『編輯』→『填滿』→『數列』1.選擇位置2.類型3.間距4.終止值X值輸入Y的函數將此儲存格的公式複製到其他Y儲存格1.選擇範圍2.複製1.複製結果2.選擇所有X-Y值進行繪圖可選擇X-Y散佈圖粗圖完稿

Excel绘制函数图象.docx
Excel绘制函数图象做教学工作的朋友们一定会遇到画函数曲线的问题吧!如果想快速准确地绘制一条函数曲线,可以借助EXCEL的图表功能,它能使你画的曲线既标准又漂亮。你一定会问,是不是很难学呀?其实这一点儿也不难,可以说非常简便,不信你就跟我试一试。以绘制y=|lg(6+x^3)|的曲线为例,其方法如下:在某张空白的工作表中,先输入函数的自变量:在A列的A1格输入"X=",表明这是自变量,再在A列的A2及以后的格内逐次从小到大输入自变量的各个值;实际输入的时候,通常应用等差数列输入法,先输入前二个值,定出自

Excel绘制函数图象 (2).docx
Excel绘制函数图象做教学工作的朋友们一定会遇到画函数曲线的问题吧!如果想快速准确地绘制一条函数曲线,可以借助EXCEL的图表功能,它能使你画的曲线既标准又漂亮。你一定会问,是不是很难学呀?其实这一点儿也不难,可以说非常简便,不信你就跟我试一试。以绘制y=|lg(6+x^3)|的曲线为例,其方法如下:在某张空白的工作表中,先输入函数的自变量:在A列的A1格输入"X=",表明这是自变量,再在A列的A2及以后的格内逐次从小到大输入自变量的各个值;实际输入的时候,通常应用等差数列输入法,先输入前二个值,定出自